Chart 1: The Brent/SPX Cycle
The blue line below shows the relative performance of Brent crude ($BRENT) versus the S&P 500 Index ($SPX). Over the past 30 years, this relative performance cycle has been strong and recurring:
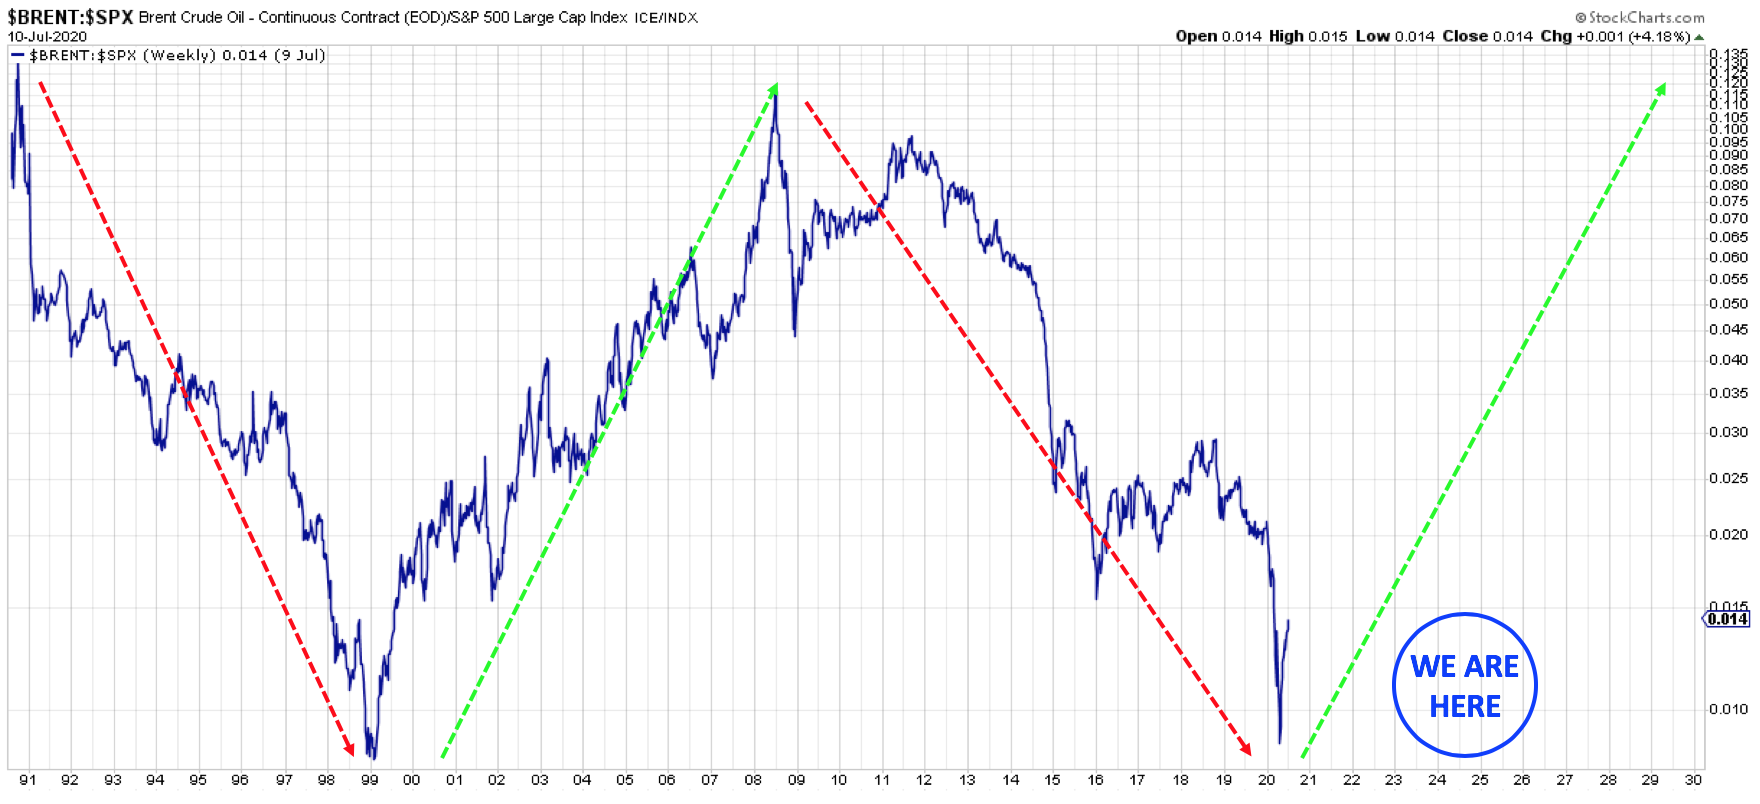
Q: Do we appear to be near the bottom of the Brent/SPX cycle? A: Yes.
Chart 2: Opportunities within the Brent/SPX Cycle
The teal line below shows the relative performance of the Dow Jones U.S. Marine Transportation Index ($DJUSMT) versus $SPX. Given where we are in the Brent/SPX cycle, active value managers should be searching for opportunities across the marine transportation industry:

Q: Do marine transports look correlated to the Brent/SPX cycle? A: Yes.
Chart 3: The Long-Term Tanker Trade
The pink line below shows the relative performance of Frontline (FRO), a large publicly traded tanker company, versus the $SPX. Diving deeper into the marine transportation industry, and using FRO as a simple example, we believe there is considerable opportunity in the tanker market. Additionally, and contrary to recent tanker headlines, relative performance trends can be far more sustainable than most investors realize:
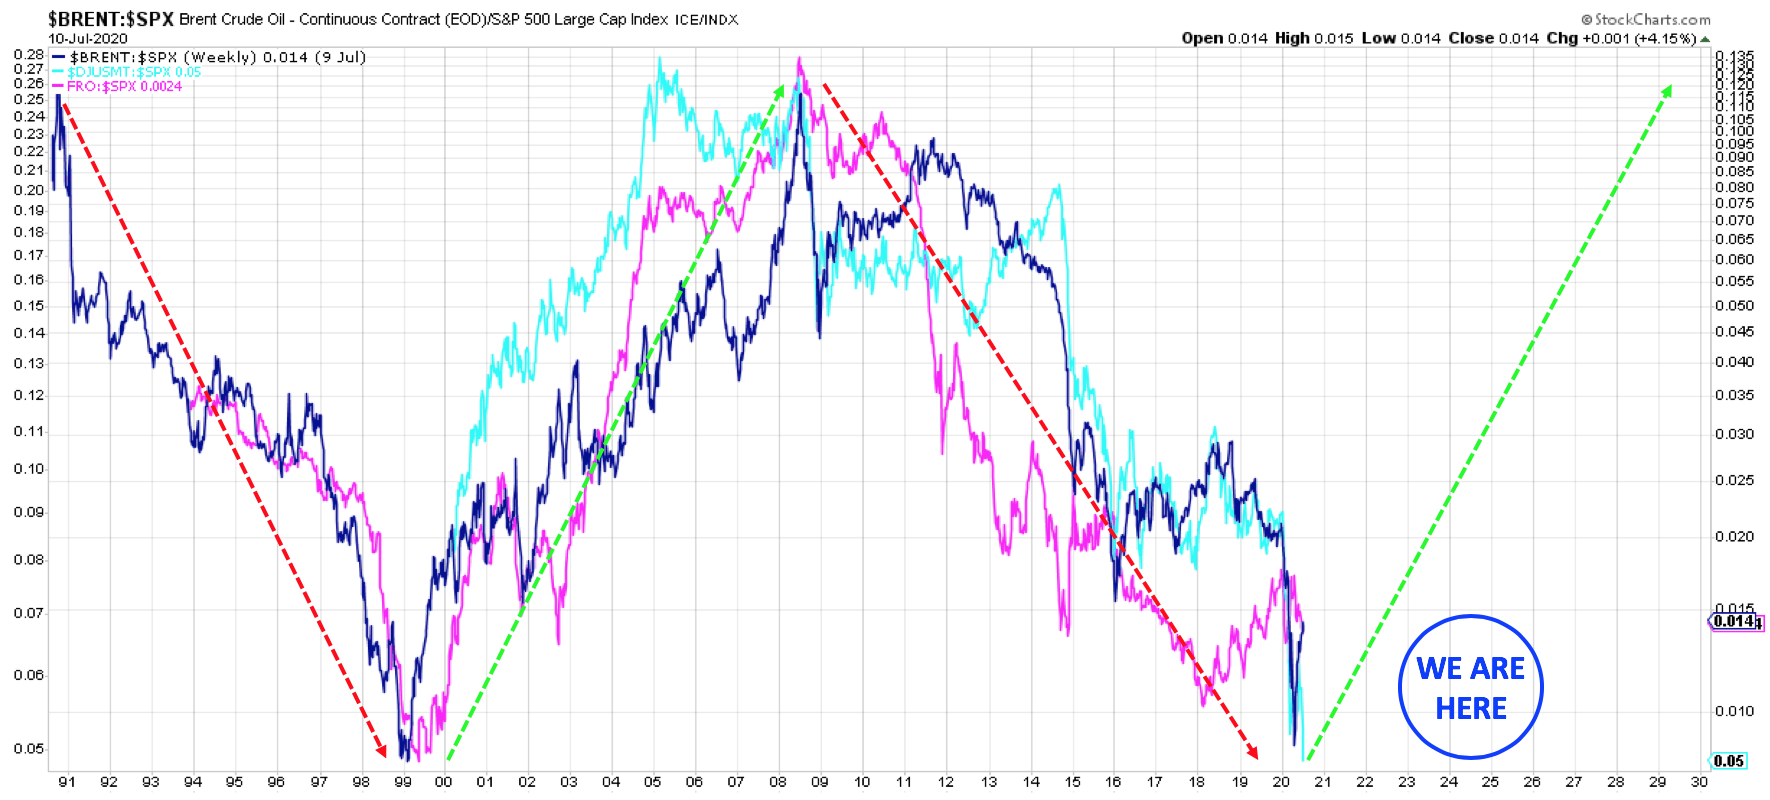
Q: Does the timing look right if one has a 5-7 year horizon? A: Yes.
Commentary:
First, we think it is important to emphasize that we break the portfolio into two buckets: core positions and special situations. We typically initiate core positions at 5-8 percent, while our special situations tend to start around 1-2%. Our shipping stocks fall squarely in the special situation camp, as we believe they exhibit favorable risk-reward scenarios, e.g., perhaps somewhere on the order of 50% downside to 400% upside, or better. This, however, hinges on two aspects 1.) the price we pay and 2.) an adjustment for the fact that more things can happen than will happen (risk). This means, due to the uncertainty of their economics, our bulker/tanker positions are unlikely to constitute a major portion of our portfolio. But fortunately, given the risk/reward, they need not be a substantial percentage of our portfolio to be a substantial contributor to our returns. This is one of the ways we manage risk.
We take no issue with calculations and forecasts regarding the normalized returns on capital potentially garnered by tankers over a full-cycle and thus their shareholders. The manner in which we address such questions in our portfolio is via our differentiation between core positions and special situations, which often come down to our own variant perceptions of what constitutes value and how that value will be realized in a given investment. We largely analyze special situations through a catalyst-driven lens, as opposed to a greater focus on analyzing the qualitative characteristics of core positions that we intend to hold over and/or through a full business cycle.
Shippers have historically swung between substantial discounts to NAV at cyclical troughs due to oversupply or lack of demand, and multiples of NAV at cyclical peaks due to tight supply and increased demand. Our interest is in profiting from the closing of the current discount, which, if history rhymes, is likely to happen over the coming years for reasons we will further touch on below. This does mean, however, that there is a certain amount of time decay involved (aging fleets). If we are betting on asset values, as opposed to the normalized returns on those assets, then it is imperative the assets we buy are not rapidly depreciating in value. This why fleet age is important, and for tankers, the economics underlying the clean/dirty conversion trade.
For example, clean tankers are often converted to dirty tankers between 12-15 years of age. If you buy a fleet of clean tankers at 1/2 of NAV, with an average age of 12-15, you may never receive NAV for your fleet as you will soon become the marginal supplier (price-taker) in the dirty trade. Conversely, should you buy a fleet of clean tankers at 1/2 of NAV, with an average age of 3-5 years, you have the odds in your favor, and time on your side, to potentially exit these assets at NAV or higher, at a point in the cycle when returns on capital drive up valuations to their cyclical peak.
From a macro standpoint, the previous decade (shipping cycle) was characterized by an oversupply of both capital and vessels. This led to a decade of poor returns for shipowners, and as a result, a considerable percentage of the publicly traded fleet perennially trading below NAV. Is it plausible to expect the coming decade to be characterized by a dearth of capital, a tighter supply of vessels and elevated, or periods of elevated rates? We think so. This is the trade we are making: if you purchase a young fleet at a fraction of NAV, near the bottom of the cycle, the odds are in your favor to extract excess returns. This is not a promise, but a promising bargain, which we feel comfortable making when sized appropriately.
To summarize our thesis:
- The relative performance of Brent versus the S&P is near a cyclical low
- Shipping stocks follow a similar long-term pattern of performance
- Timely environment for those with 5-7 year investment horizons